Mon–Thu: 8:00 AM–4:30 PM · Fri: 8:00 AM–3:30 PM
Analysis software

PAT

Post Analysis Tool · File-based roll report analysis

CAMEN inspects the running web and stores every roll as a report. PAT analyses those reports — file-based, without a database, opened straight from CAMEN. From the roll overview through the defect map to the individual defect image.

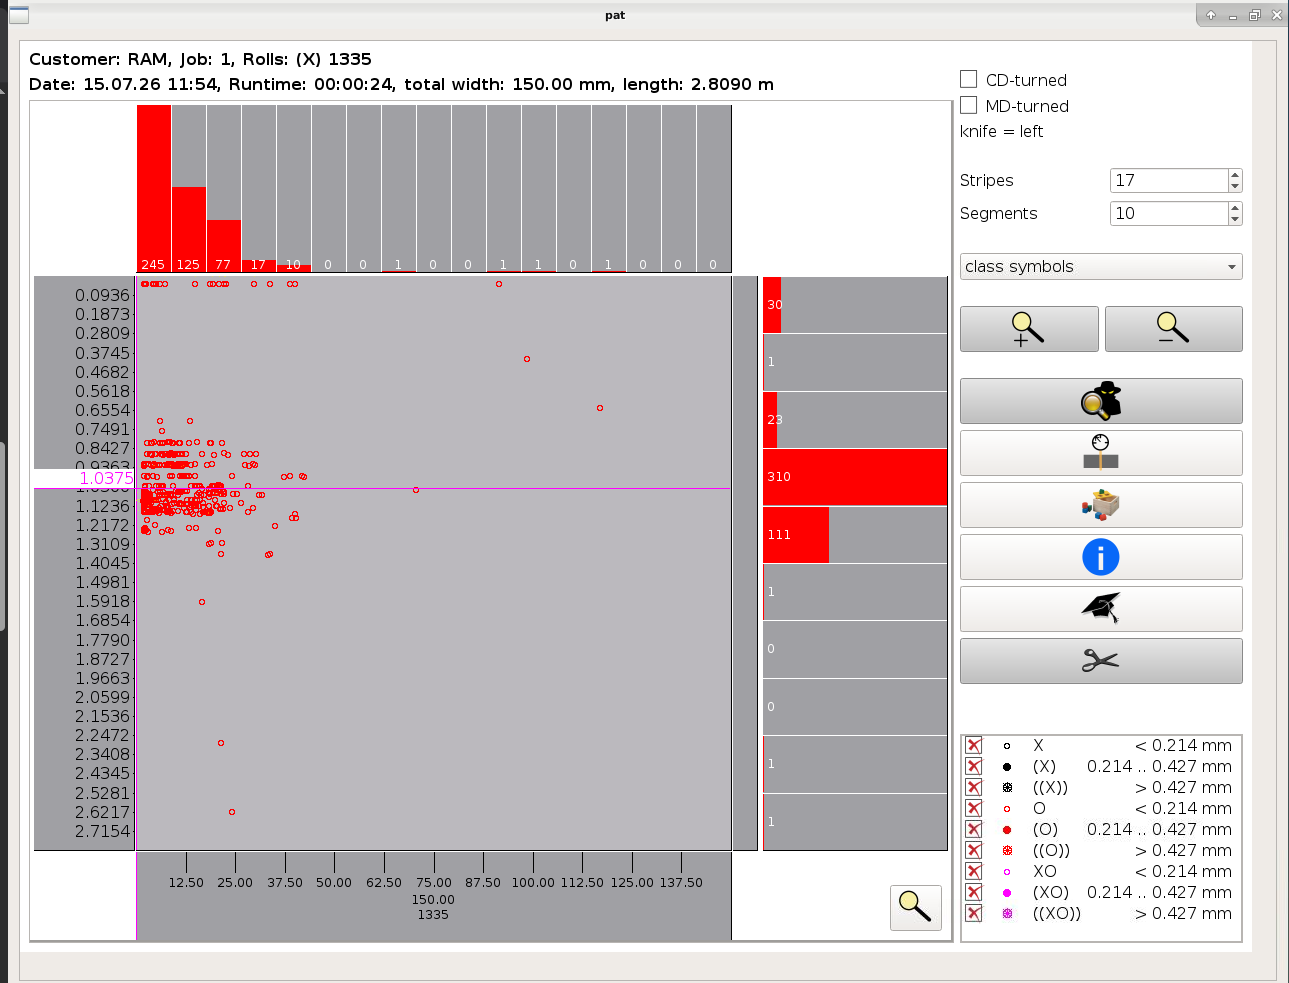
PAT interface: defect distribution of a roll across stripes and segments with defect classes by size// PAT · defect distribution of a roll
[ 01 ]Overview

Analysis without a database

Defects are stored in roll reports together with all associated data — length, width, area, roll number and more. PAT reads these reports directly as files; no database server is required. PAT is opened via its icon on the CAMEN start page, after which you select the period you want.

From the overview of all rolls the path leads to the individual roll: graphical report with the defect map, defect images with all recorded attributes, opacity and analogue trends. Reports can be cut, corrected, exported, printed and saved locally.

Result: a lean analysis tool that runs on any workstation — and from which type classifiers travel back into production.
At a glance
Full name
Post Analysis Tool
Data source
Roll reports as files — no database
Launch
Straight from CAMEN
Alternative
vSTAT — the SQL-based variant
[ 02 ]Key benefits

What PAT delivers for you

No database required

PAT works directly on the report files — with no database server behind it.

Opened straight from CAMEN

One icon on the CAMEN start page is all it takes — nothing to set up, nothing to configure.

Assess defects visually

Stored camera images, contrast enhancement, false colour and threshold analysis make details visible.

Runs on any workstation

PAT is available for Windows, macOS and Linux — away from the production line as well.

[ 03 ]Structure

From the overview to the single roll

You select the period — and then work on two levels.

Many rolls

Roll reports

Four views of the period: the table view with one row per roll, the summary with the defect count per class, the graphical view as bars over time, and the “Vision Roll Report” with one trace per defect class.

Single roll

Analyse rolls

A press on the roll opens the report: table view, summary, graphical report with the defect map, opacity report, opacity and analogue trends, information window, edit report data and save the report.

[ 04 ]Core features

Technology in detail

Table view

One row per roll with job, customer, shift, length, runtime and defect count — reject rolls are highlighted in red.

Summary

The defect count per defect class, either absolute or area-related — for a single roll or the entire period.

Graphical view

The defect count of all rolls over date and time; pressing a bar opens the corresponding roll report.

Vision roll report

The statistical view shows one trace per defect class; every trace can be switched on and off, colour and line width are selectable.

Graphical report

The defect map shows every flaw at its actual position — together with the distribution across stripes and segments.

Reverse the orientation

The report can be mirrored across the web (CD) and in machine direction (MD) — so the defect position is right when unwinding, too.

Defect images instead of symbols

Class symbols, defect images or both: where an image exists it is shown, otherwise the symbol.

Detail view with attributes

Area, width, length, form, position in machine and cross direction and the grey values — for every single defect.

Image processing

Raise the contrast, switch to false colour or highlight the detected defect area — also before printing.

Threshold analysis

On the stored defect image you can try out at which threshold offset a flaw is reliably detected — without touching running production.

Create a type classifier

Create a new type classifier straight from a defect image, or teach the defect to an existing one.

Exchange classifiers

Type classifiers can be transferred between PAT and CAMEN and thus passed on from one production line to the next.

Opacity report and trend

Average, minimum and maximum together with the curve across the roll. Opacity, haze and gloss are options and not part of the standard software.

Trend of selectable analogue traces

Further analogue measurands as a curve over running metres or time — provided the traces are enabled in CAMEN.

Information window

Key data on the report, including the inspected share of the roll: below 100 %, not the entire web was inspected.

Split rolls and slits

Cut a report in machine direction into two separate reports at any position — and adjust the slit cuts in cross direction afterwards.

Edit report data

Correct header data such as customer, job, shift, article number or operation number afterwards, and print them.

Export, printing and saving

Output selected rolls as a file — format, fields and separators are selectable. Every view can be printed, every report saved locally.

[ 05 ]Interplay

How PAT fits into your line

Capture

CAMEN

Inspects the running web, classifies the defects and stores every roll as a report.

Analyse

PAT

Reads the same roll reports on a file basis — opened straight from CAMEN or on a workstation PC.

Alternative

vSTAT

Where the reports are additionally written into an SQL database, vSTAT analyses them there — including statistics across many rolls.

Type classifiers can be exchanged between PAT and CAMEN. A pattern taught on a defect image travels back into the running inspection — and from there to the next production line.
[ 06 ]Fact sheet

Technical data

Software
Full name
Post Analysis Tool
Data source
Roll reports as files — no database
Launch
Via the PAT icon on the CAMEN start page
Prerequisite
CAMEN — PAT is operated from within CAMEN
Installation
Pre-installed on the industrial PC that R.A.M. supplies with the system
Roll reports
Overview
Table view, summary, graphical view, statistical view (Vision Roll Report)
Single roll
Table view, summary, graphical report, opacity report, trends, information window
Summary
Defect count per class, absolute and area-related
Graphical report
Display
Defect map with stripes and segments; symbols, defect images or both
Orientation
Mirrorable in cross (CD) and machine direction (MD)
Defect image
Attributes, image processing, highlight the defect area, threshold analysis, hide defects
Editing
Split rolls
Cut in machine direction (MD) into two separate reports
Slit cuts
Adjust afterwards in cross direction (CD)
Report data
Correct header data and print it
Classification
Type classifiers
Create from the defect image or teach in
Exchange
Transfer between PAT and CAMEN
Output
Export
File export with selectable fields, separators and decimal point
Printing and saving
Printing of every view; save the report locally on the hard disk
Options
Opacity, haze, gloss
Not part of the standard software — available on request
Analogue traces
Displayed provided the traces are enabled in CAMEN
Systems
Supported
FIS 1000 · ITG 500 · ITG 850 – LC
PQMex®
Works with CAMEN; primarily used with the FIS systems

Our team of experts is ready to help

Interested in PAT?

Talk to us about your analysis — we will show you PAT with real roll reports.