Mon–Thu: 8:00 AM–4:30 PM · Fri: 8:00 AM–3:30 PM
Production software

plastPMS

Plastic Production Monitoring System · Several lines at one workstation

Where several production lines run side by side, plastPMS brings them together on one computer: live monitoring, roll reports, statistics and defect-map overlay — freely arranged and switchable from one line to the next at any time.

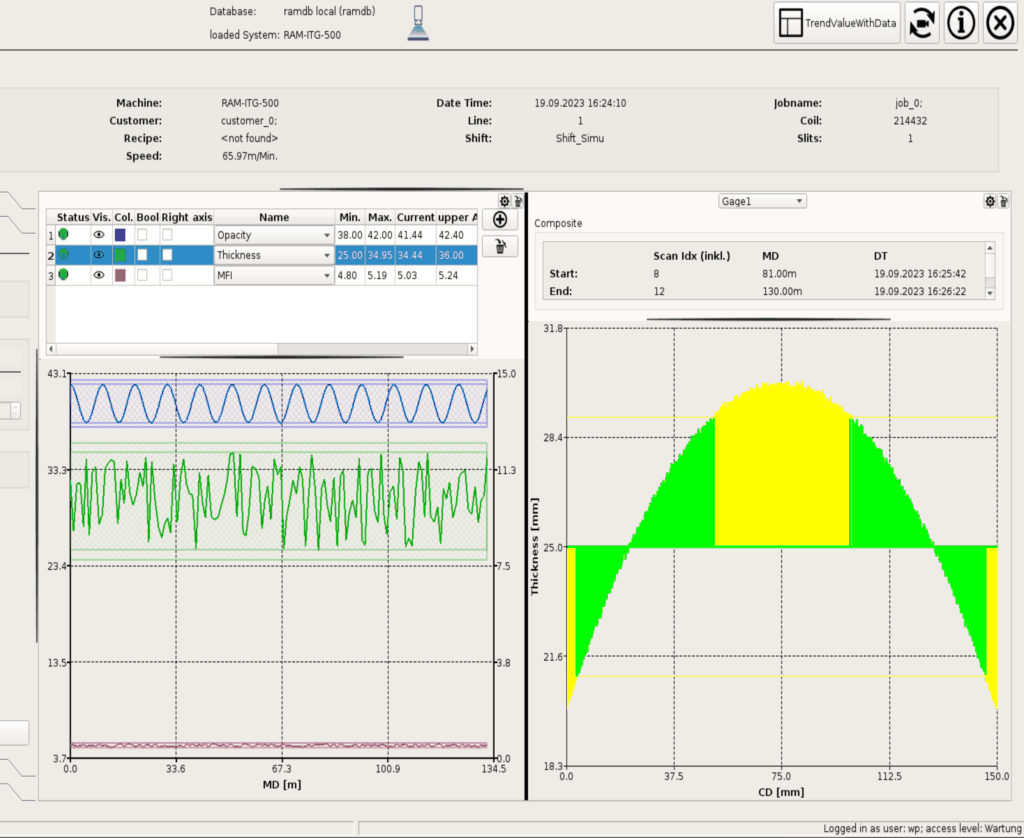
plastPMS interface showing trend curves for opacity, thickness and MFI alongside a cross-direction thickness profile // plastPMS · Live-Monitoring
[ 01 ]Overview

Several lines, one workstation

plastPMS is a separate, optional system. It accesses the same SQL database that CAMEN writes its roll reports into — but not only for one line: the system menu lets you switch between every line held in the selected database. Each line brings its own users; you log in once the system has been selected.

The interface is divided into four working areas: Monitoring for the running production, Report View for the individual roll report, Statistic for the analysis across many rolls, and Overlay for superimposing several defect maps.

Result: one workstation from which the condition of several extrusion lines can be compared — live and in retrospect.
At a glance
Type
Separate, optional system
Operating system
Windows 10 or Debian 10
Data source
SQL database (written by CAMEN)
Lines
Several systems in one database
[ 02 ]Key benefits

What plastPMS delivers for you

Several lines in view

Switch between every line in a database without leaving the workstation.

Views built to suit you

Combine widgets into formations, save them under a name and call them up again.

Live and in retrospect

Monitor the running production and analyse completed rolls in the same program.

Spot the patterns

Overlay superimposes defect maps and reveals position-related clusters of defects.

[ 03 ]Structure

Four areas in one interface

You select the database and the line — and then work in one of the four areas.

Live

Monitoring

Freely arranged formations of trend, trend-value, map, Campbell and thickness widgets show the running production. Formations can be saved, loaded and linked with one another.

Single roll

Report View

Roll table with search, defect map with cut and comment functions, defect list with defect images, analogue trends, job data and print preview.

Many rolls

Statistic

Defects per classifier, RollSummary across a period, DefectSummary over time, and the extended rolls table that combines reports from several systems.

Comparison

Overlay

Superimpose any number of defect maps — colour-coded or merged. Recurring clusters of defects become visible.

[ 04 ]Core features

Technology in detail

Switching systems

The system menu lists every line in the selected database; once a line is chosen, its own user logs in.

Access levels

Five levels — locked, operator, foreman, production management, maintenance — release the functions step by step.

Formation handler

Save, load and delete widget arrangements under a name. Saving and editing from access level 2.

Trend and trend value

Analogue values as a curve, a table or a circular gauge — with min, max, warning and alarm limits per sensor.

Map widget

Inspection data, thickness measurement and the Campbell diagram can be superimposed in one view and reordered.

Thickness widgets

SingleScan, candlestick, histogram and composite show the thickness data from four angles — scaled automatically or manually.

Linking formations

From access level 2 a button jumps straight into another formation — and the back button returns you.

Roll table with search

Up to 1000 roll reports by default. The search menu filters by period, coil no., job, customer, shift, grade and more; search criteria can be saved.

Defect map with cut

Length/width and MD/CD define a section, which is highlighted on the map and saved as its own entry in the roll table.

Comments

Place area and MD comments with their own colour directly on the defect map — and change position, colour and text later.

Defect images

In the defect list a double click leads to the individual defect with its recorded image and all measured attributes.

Analogue trend

Switch sensors on individually, assign them to the right-hand Y axis and scale the axes manually — over MD, date/time or time after start.

Multiple maps

Display several defect maps below one another; a filter dialog narrows the selection by numerous criteria.

Extended rolls table

Combines roll reports from several systems in one table — the basis for comparing across lines.

Printing and export

Single or batch printing, portrait or landscape, each with preview. Defect data is exported as CSV with a selectable separator.

Everyday handling

Touchscreen mode, day/night layout and a screenshot function sit directly in the header bar.

[ 05 ]Interplay

How plastPMS fits into your lines

Capture

CAMEN

Inspects the running web on every line, classifies the defects and writes roll reports and analogue data into the SQL database.

Monitor and analyse

plastPMS

Accesses the same database — for several lines at once, live in Monitoring and in retrospect in Report View, Statistic and Overlay.

Roll report analysis

vSTAT · PAT

For pure roll report analysis: vSTAT SQL-based, PAT file-based — without a database.

Additional measurements – for example from an online MFI sensor – can be integrated as analogue data and correlated with inspection quality. This shows how external influences change material quality and process parameters.

plastPMS is a separate, optional system. It replaces neither CAMEN nor vSTAT but adds the shared view across several lines.
[ 06 ]Fact sheet

Technical data

Software
Full name
Plastic Production Monitoring System
Type
Standalone, optional system — the only R.A.M. software that can also be installed on your own computers
Operating system
Windows 10 or Debian 10
Data source
SQL database, written by CAMEN
Access levels
5 — locked · operator · foreman · production management · maintenance
Areas
Monitoring
Formations of trend, trend value, map, Campbell and thickness (SingleScan, candlestick, histogram, composite)
Report View
Roll table, defect map, all defects, analogue trend, job/line options, multiple maps, comment, print, Campbell
Statistic
Defects per classifier, RollSummary, DefectSummary, extended rolls table
Overlay
Superimposition of any number of defect maps, colour-coded or merged
Output
Export
CSV with selectable separator
Printing
Single and batch printing, portrait/landscape, with preview

Our team of experts is ready to help

Interested in plastPMS?

Talk to us about your lines — we will show you plastPMS with real production data.