Mon–Thu: 8:00 AM–4:30 PM · Fri: 8:00 AM–3:30 PM
Analysis software

vSTAT

Visualization and Statistical Analysis Tool · Roll report analysis

CAMEN records every roll — vSTAT turns the data into insight: view and analyse roll reports and turn them into documents. From a single defect to statistics across hundreds of rolls.

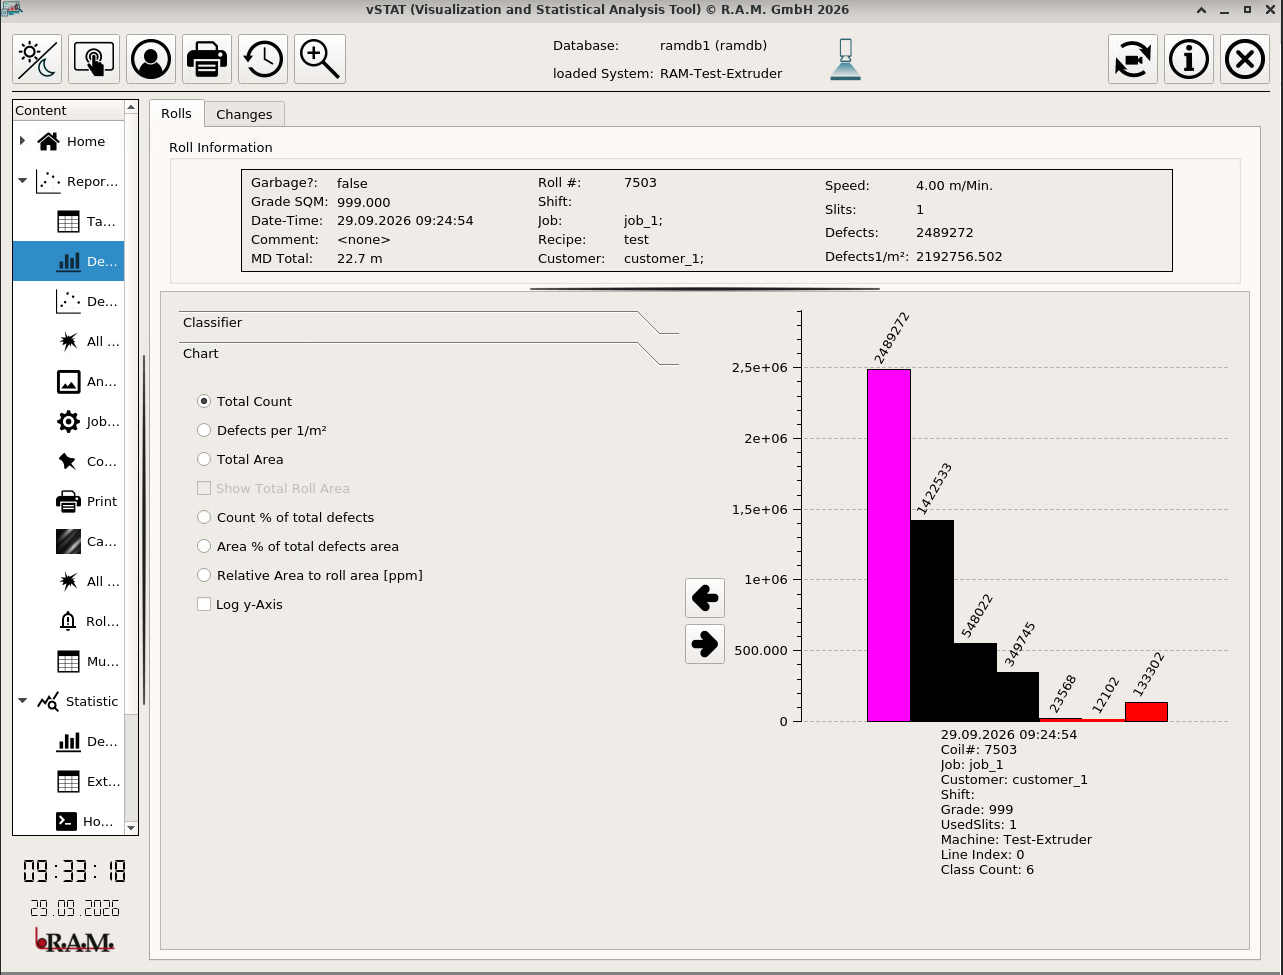
vSTAT interface: roll information and defect overview of a roll by defect class// vSTAT · defect overview of a roll
[ 01 ]Overview

Turning measurement data into insight

During production, CAMEN writes every inspected roll into an SQL database as a roll report. vSTAT reads those reports — either for a single roll or across an entire production period.

The interface is divided into four program areas: Report View evaluates a single roll, Statistic compares many rolls, Overlay superimposes defect maps, and ramRED shows recipe parameters together with their change history. Results can be exported as CSV or issued as a PDF report — with your own logo if required.

Result: every roll stays traceable, quality trends become visible — and customers receive solid documentation.
At a glance
Data source
SQL database (written by CAMEN)
Languages
German · English · Polish
Alternative
PAT — the file-based alternative
[ 02 ]Key benefits

What vSTAT delivers for you

Every roll traceable

Defects, classes, images and job data remain permanently available.

Trends across many rolls

Batches, shifts and products can be compared directly with one another.

Documentation for your customers

PDF reports, with your own logo and in the scope you require.

Reuse your data

CSV export into your quality management, spreadsheet or database.

[ 03 ]Structure

Four views of your production

You select the database and the system, then work in one of the program areas. Report View is included in every installation; the other areas are licensed separately.

Single roll

Report

Everything about one roll: events, defect map, defect list with defect images, analogue trends, job data, comments and the classification summary.

Many rolls

Statistic

The view across your production: roll overview with selectable columns, filters, classifier statistics, extended roll evaluation with warning and alarm thresholds, charts, export and PDF report.

Overlaying rolls

Overlay

Superimposes the defect maps of several rolls. Shows which defects a process step has added — or which keep recurring at the same position.

Recipes

ramRED

Access to the recipe parameters of the inspection system, the classifier definitions and the complete change history: who changed what and when.

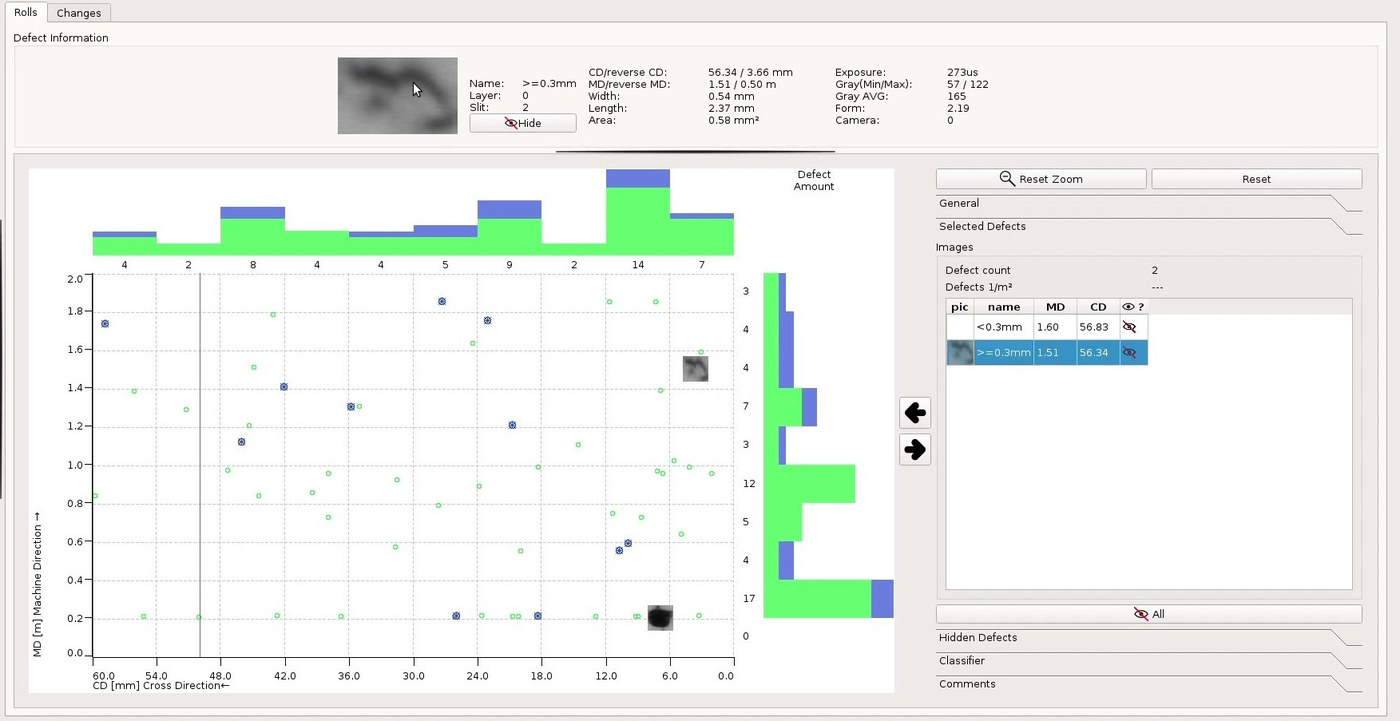
vSTAT Report: defect map of a roll with the camera image of the selected defect
Report – defect map of a single roll. Top: the selected defect with its camera image, position and size; along the edges: the distribution across and along the web.
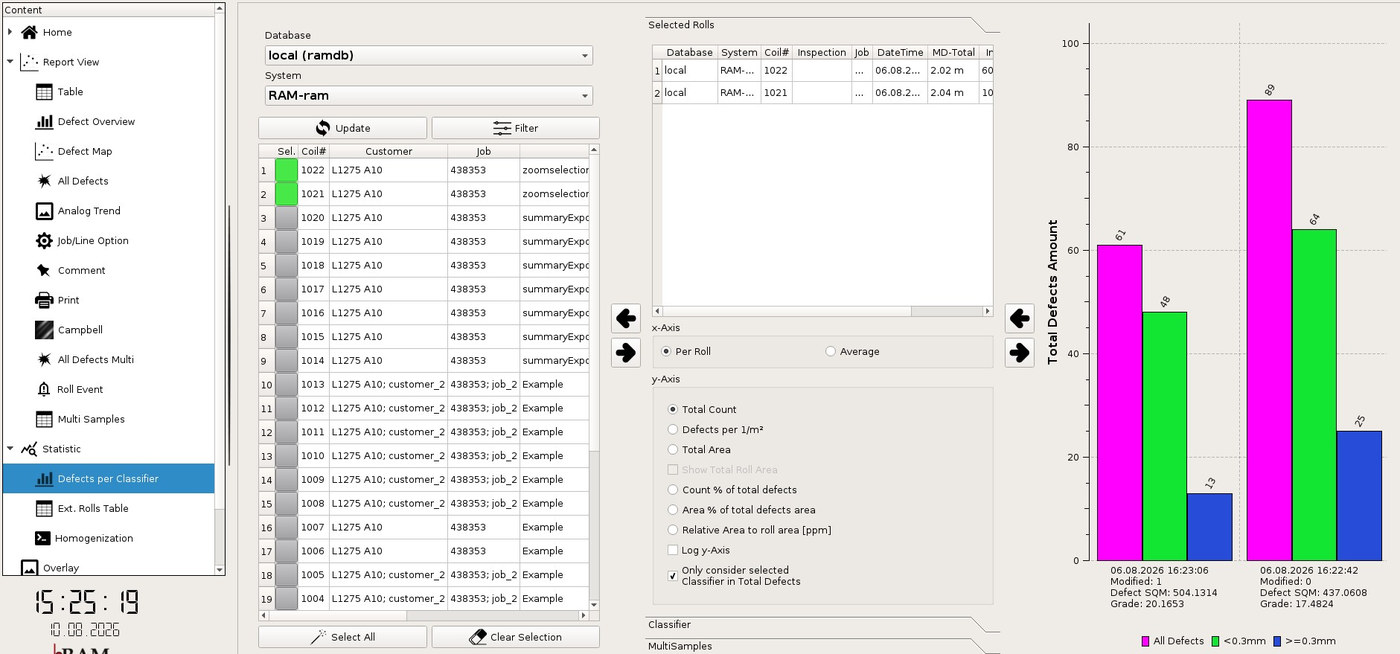
vSTAT Statistic: defects per classifier for two selected rolls
Statistic – defects per classifier. Select rolls from the database and compare them side by side; they can also be combined into multi samples.

Licensing: Report View is part of every vSTAT installation. Statistic, Overlay and ramRED are licensed separately; the Homogenization view requires an additional licence beyond the statistics licence. Areas without a licence are not accessible in the interface.

[ 04 ]Core features

Technology in detail

Select database and system

vSTAT accesses the report database; several systems can be analysed separately.

Open a roll report

Events and key figures of a roll at a glance — without interrupting production.

Defect map

Every defect at its actual position across web width and roll length.

Defect list and detail info

From the list entry straight to the individual defect with all recorded attributes.

Defect images

The stored camera image of each defect — for assessment without handling the roll.

Defect table with selectable columns

Show or hide time stamp, position in machine and cross direction, size, area and thumbnail.

Analogue trends

Additional measurands as a curve across the roll — viewed together with the defects.

Analysis functions

Investigate anomalies in a targeted way and narrow down causes of process deviations.

Job data and comments

Customer, order and shift are stored; remarks stay attached to the report.

Defects per class

The classification summary shows which defect types characterise a roll.

Roll selection and filters

Narrow down period, product or shift and analyse only the relevant rolls.

Diagrams across many rolls

Freely scalable axes and trend curves make quality developments visible.

CSV export

Fields, separators and decimal point are configurable — to match your target system.

PDF report

Report type, orientation and custom logo selectable; optionally as a summary per roll.

Cutting roll reports

From an existing report, a segment in machine direction or a width range in cross direction can be created as a report of its own.

Grouping reports into one sample

Several roll reports can be combined into a multi sample and evaluated together.

Warning and alarm thresholds

The extended roll evaluation shows key figures against defined thresholds and reports when compared rolls use different recipes.

Planning a blend (Homogenization)

Two virtual silos are filled with roll reports and their quantities. The result is the homogenised quality — the quantity-weighted grade across all reports contained. This lets you check in advance whether, for example, 50 kg of lower-quality material can be blended into 950 kg of better material without the blend losing its quality grade.

Access levels as in CAMEN

locked, machine operator, production manager and maintenance personnel. Functions that alter data — cutting rolls and deleting reports — are reserved for maintenance personnel.

[ 05 ]Interplay

How vSTAT fits into your line

Capture

CAMEN

Inspects the running web, classifies the defects and writes every roll into the database as a report.

Analyse

vSTAT

Reads the reports from the database — for the single roll and for statistics across many rolls.

Alternative

PAT

Where no database is wanted, PAT evaluates the same roll reports on a file basis — mainly in use with the FIS systems.

vSTAT is part of the software portfolio around CAMEN and works with all R.A.M. systems.
[ 06 ]Fact sheet

Technical data

Software
Full name
Visualization and Statistical Analysis Tool
Languages
German · English · Polish
Data source
SQL report database, written by CAMEN
Prerequisite
CAMEN — vSTAT is operated from within CAMEN
Installation
Pre-installed on the industrial PC that R.A.M. supplies with the system
Analysis
Report
Single roll: events, defect map, defect list, defect images, trends
Statistic
Many rolls: roll overview, filters, defect table, diagrams
Licensing
Report View included; Statistic, Overlay and ramRED licensed separately
Classification
Overview of defects per class
Output
Export
CSV with configurable fields and separators
Printing
PDF report, report type and custom logo selectable
Systems
All R.A.M. systems: FIS 1000 · ITG 500 · ITG 850 – LC · PQMex®

Our team of experts is ready to help

Interested in vSTAT?

Talk to us about your analysis — we will show you vSTAT with real roll reports.